All Images
Image 1 of 1: ‘Value of 65.0 with weight_kg label stuck on it’

Image 1 of 1: ‘Value of 65.0 with label weight_kg stuck on it, and value of 143.0 with label weight_lb stuck on it’

Image 1 of 1: ‘Value of 100.0 with label weight_kg stuck on it, and value of 143.0 with label weight_lb stuck on it’

Image 1 of 1: ‘A line graph representing the temperature readings from the Argo float data.’
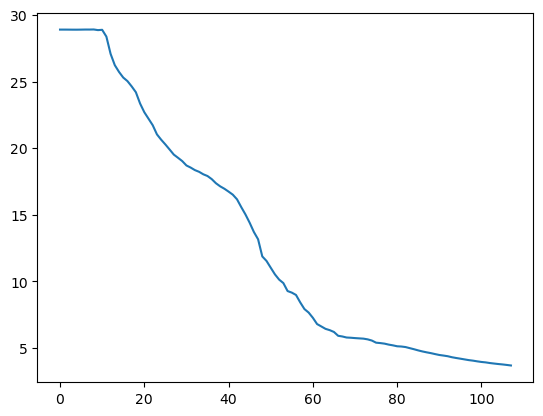
Image 1 of 1: ‘A line graph showing the temperatuer from the Argo data with axes labels.’
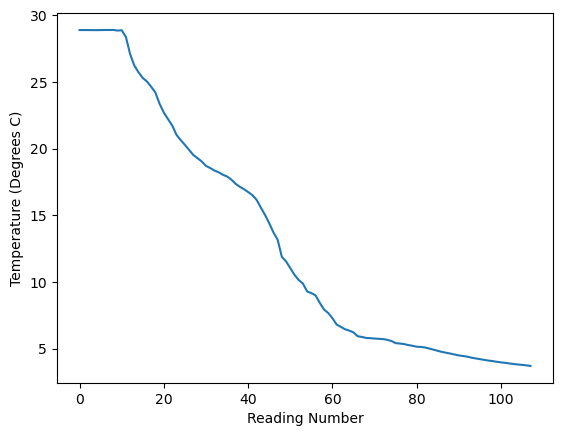
Image 1 of 1: ‘A scatter graph comparing temperature and presssure.’
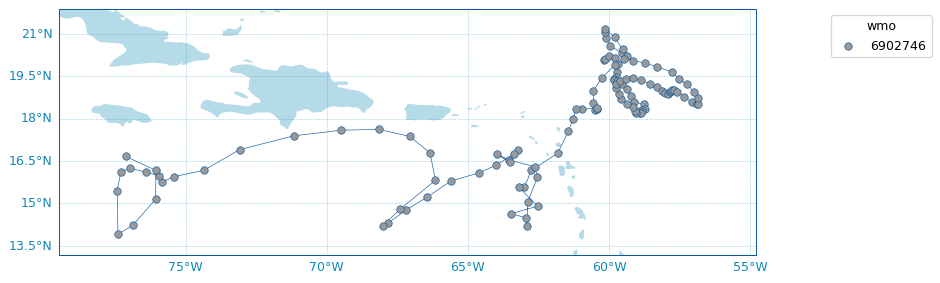
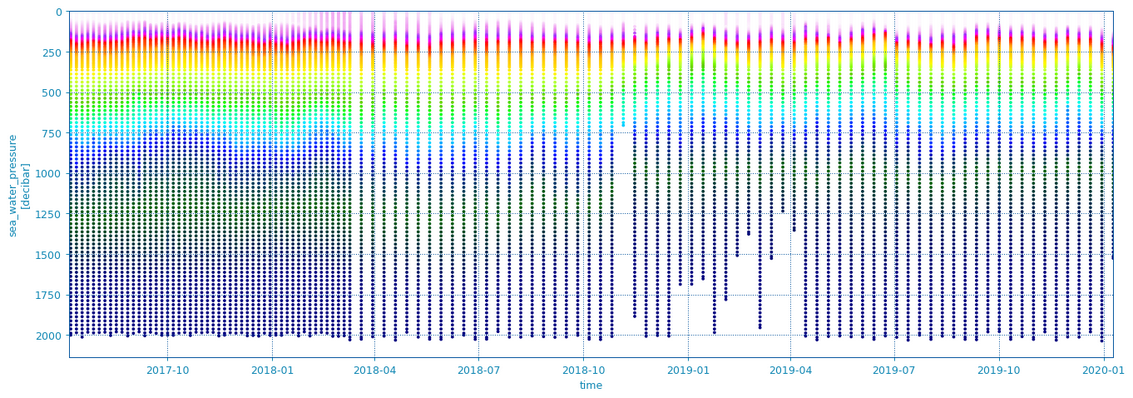
Image 1 of 1: ‘A scatter graph from Argopy showing temperature, depth and time.’