Zarr-maps
Leaflet and OpenLayers layers for interactive 2D visualization of geospatial data stored in Zarr format.
Zarr-maps enables direct, client-side visualization of scientific datasets stored in the Zarr format. No preprocessing. No tile servers. No backend.
It provides Leaflet and OpenLayers layers that stream and render multidimensional geospatial datasets directly from HTTP/S3/GCS object storage.
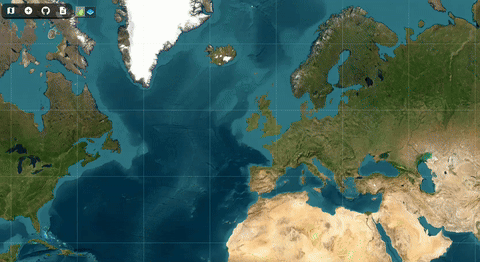
Example of visualizing a Zarr dataset in Leaflet and OpenLayers maps using zarr-maps. You can dynamically change time slices, colormaps, and scale ranges.
Features
- Zarr v2 and v3 support
- Single-scale and multiscale datasets (following the format generated using ndpyramid)
- Automatic resolution selection for multiscale datasets
- CRS-aware (EPSG:4326 & EPSG:3857)
- WebGL-accelerated rendering
- Dynamic styling (colormap, opacity, scaling, slices, animation)
Provider Overview
| Provider | Purpose | Description |
|---|---|---|
| ZarrLayerProvider | 2D scalar fields | Renders imagery layers from single/multiscale Zarr arrays. |
| ZarrCubeProvider | 3D volumetric cubes | Renders 3D slices (horizontal & vertical). |
| ZarrCubeVelocityProvider | 3D vector fields | Animated particle advection from U/V components. |
Architecture Diagram (High-level)
Zarr Store (HTTP / S3 / GCS)
↓
zarrita.js (Zarr client)
↓
Zarr-maps Layers
↓
Leaflet / OpenLayers
↓
2D Interactive Visualization
Acknowledgements
This tool is built with:
This work is part of the Atlantis project, a UK initiative supporting long-term ocean observations and marine science in the Atlantic. The project is led by the National Oceanography Centre (NOC).